· 14 min read
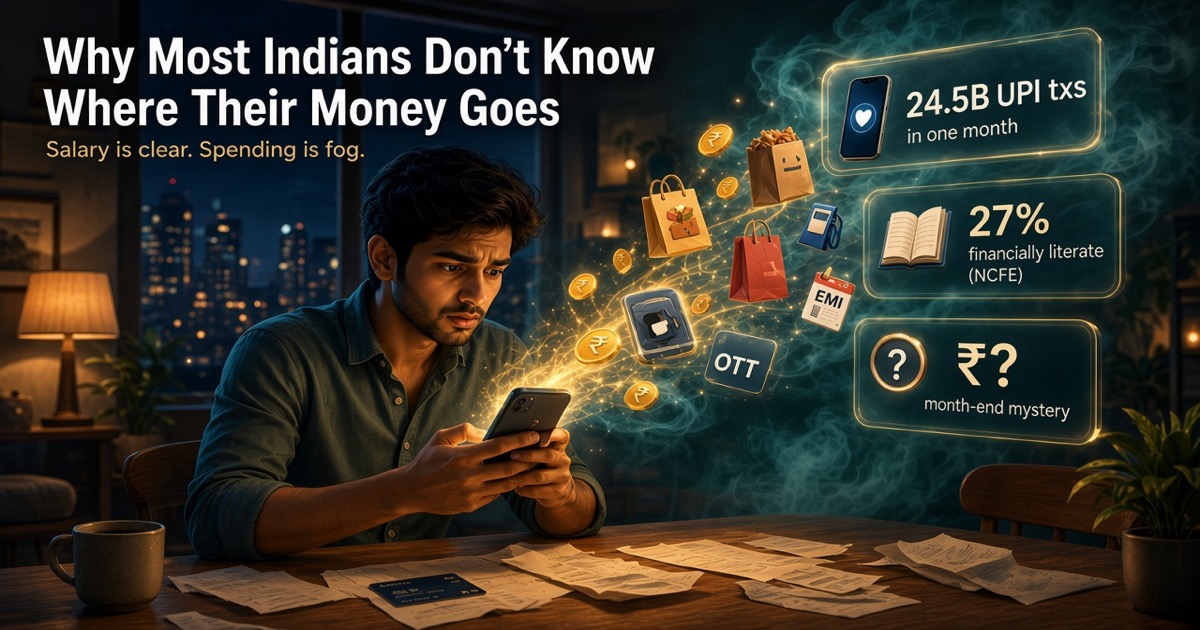
Why Most Indians Don't Know Where Their Money Goes
Ask an Indian professional three questions.
What is your monthly salary? Most people answer instantly.
What is your bank balance right now? Many can check in a few taps.
How much did you spend last month on food, shopping, subscriptions, fuel, EMIs and transfers — separately? Most people pause.
That pause is the story of modern Indian money.
India has made sending money almost frictionless. Understanding money has not kept pace.
This is not a story about people being careless. It is a story about a financial system that became extremely good at payments — and left households with fragmented visibility into their own cash flow.
The Visibility Gap, in Official Numbers
Start with how much India pays digitally.
According to NPCI product statistics, UPI processed 24.51 billion transactions worth ₹29.82 lakh crore in August 2026 alone — a record monthly volume, with value roughly 20% higher than August 2025.
Credit cards add another layer. RBI-reported data for August 2026 shows approximately 124.05 million credit cards outstanding and about ₹2.02 lakh crore in monthly card spends.
Money is moving constantly — through bank accounts, UPI apps, cards, wallets, auto-debits, EMIs and merchant QR codes. The problem is not transaction scarcity. The problem is that the average household never sees those flows as one coherent picture.
- Transactions: UPI volume — August 2026 (NPCI)
- Monthly value: UPI value — +20% YoY
- Cards outstanding: Credit cards — August 2026 (RBI)
- Monthly spends: Card spends — August 2026 (RBI)
Inclusion Grew Faster Than Money Confidence
India’s access story is real.
The World Bank’s Global Findex 2025 (survey fieldwork in 2024) reports that about 89% of Indian adults have a financial account — up from roughly 78% in 2021. Gender and rural gaps in basic account ownership have narrowed sharply.
But account ownership is not the same as money awareness.
Findex also notes that inactivity remains high by global standards: about 16% of Indian account owners had not used their account in the past 12 months — more than double the average inactivity rate among account owners in other low- and middle-income economies cited in the report.
Access opened the door. Visibility into spending behaviour is still uneven.
- 2024 survey (Findex 2025): Account ownership — Adults with a financial account
- Of account owners: Inactive owners — No use in the past 12 months
Financial Literacy Improved — But Behaviour Still Lags
The National Centre for Financial Education’s All-India Financial Literacy and Inclusion Survey (NCFE-FLIS) 2019 remains the clearest nationwide OECD-INFE benchmark. It found that 27.18% of respondents met the minimum thresholds across financial knowledge, behaviour and attitude — up from 20% in 2013, but still leaving a large majority below the full literacy bar.
Within that 2019 survey:
• 33% of urban and 24% of rural respondents were financially literate • 29% of men and 21% of women met the threshold • About 74% reported that their household had a budget
That last figure matters. Many Indians say they budget. Far fewer can reconstruct where money actually went across dozens of digital channels.
A later Mid-Term Evaluation under NSFE 2020–25 (survey frame of about 10,000 respondents) reported further gains versus the 2019 NFLIS baselines — for example, women’s measured literacy rising from 21% to 41%, men’s from 29% to 37%, rural from 24% to 38%, and urban from 33% to 42%. Progress is real. A majority still do not clear OECD-style literacy thresholds in many segments — and literacy scores are not the same as month-end spending clarity.
- NCFE-FLIS 2019: Fully literate — OECD knowledge + behaviour + attitude
- Household budget reported: Say they budget — NCFE-FLIS 2019 behaviour item
- Literacy improvement: Women (MTE) — 2019 NFLIS vs MTE NSFE
- Literacy improvement: Rural (MTE) — Gap remains vs urban 42%
Having a mental budget is not the same as knowing your category-wise cash flow. In a UPI-first economy, those are two different skills.
Spending Itself Has Become Harder to See
Official consumption data shows why “where did it go?” is harder than it used to be.
MoSPI’s Household Consumption Expenditure Survey (HCES) 2023–24 estimates average monthly per capita consumption expenditure (MPCE) at ₹4,122 in rural India and ₹6,996 in urban India.
Non-food spending now dominates:
• Rural: food 47.04% of MPCE, non-food 52.96% • Urban: food 39.68% of MPCE, non-food 60.32%
Non-food is not one category. It is conveyance, durables, entertainment, communication, education, health, toiletries, processed beverages and a long list of small, frequent purchases — exactly the kind of spending that feels trivial in the moment and invisible at month-end.
- 47.04%: Rural food — Of rural MPCE
- 52.96%: Rural non-food — Of rural MPCE
- 39.68%: Urban food — Of urban MPCE
- 60.32%: Urban non-food — Of urban MPCE
Five Reasons Indians Lose Track of Money
The data above describes the environment. Daily behaviour explains the fog.
1. Payments are frictionless — memory is not
A ₹180 chai-and-snack UPI, a ₹499 subscription renewal, a ₹1,200 grocery QR and a ₹3,000 card EMI conversion can all happen in one evening. Individually, none feels like a financial decision. Collectively, they rewrite the month.
Cash once forced a pause. UPI and cards removed that pause. NPCI and RBI statistics show the scale of that removal — billions of low-friction payments every month.
2. Money now leaves through many doors
A typical salaried household may use:
- One or more salary accounts
- UPI across multiple apps
- Debit and credit cards
- Auto-pay for SIPs, insurance and utilities
- EMIs for devices, education or personal loans
- Wallets and merchant apps
- Transfers to family and informal savings
Bank balance is a residual. It is not a spending map. Looking at one app’s statement is like reading one chapter of a book.
3. Credit makes spending feel cheaper than it is
RBI’s Financial Stability Report framework shows household debt rising to 45.5% of GDP by September 2025, with non-housing retail loans accounting for 58.4% of household borrowings (as of March data cited with that report cycle).
Credit is not automatically bad. Housing, education and productive borrowing can build capability. But when consumption credit, revolving card balances and “easy EMI” expand, tomorrow’s income starts funding today’s invisible spends — and month-end clarity gets worse.
4. Small leaks do not announce themselves
OTT plans, cloud storage, fitness apps, food delivery fees, convenience mark-ups, late-fee interest and unused subscriptions rarely feel like “big expenses.” They are designed not to.
Households often remember rent, school fees and the EMI. They forget the ₹200–₹800 recurring charges that quietly become ₹5,000–₹10,000 a month.
5. Savings culture can hide weak cash-flow visibility
India still saves. RBI’s Annual Report (May 2026) shows household-sector saving at 21.3% of gross national disposable income (GNDI) in 2024–25, with net household financial saving at 7.0% of GNDI (up from 5.8% in 2023–24).
Saving without tracking spending creates a false sense of control: “I invest in SIPs, so I must be fine.” SIPs can be excellent. They do not tell you whether food delivery, shopping and interest are eroding the same surplus you are trying to invest.
- Of GNDI: Household saving — FY 2024–25
- Of GNDI: Net financial saving — Up from 5.8% in FY24
- Of GNDI: Gross financial saving — Before liabilities
- Of GNDI: Gross savings (all) — Economy-wide FY25
What “Not Knowing Where Money Goes” Looks Like in Real Life
It usually does not look like crisis. It looks like confusion:
- Salary credited on the 1st — account feels empty by the 20th
- “I earn enough, but I never have surplus”
- Surprise credit-card bill despite “not shopping much”
- Multiple UPI apps, no single category total
- Family income shared informally, expenses never reconciled
- Investments continuing while revolving high-interest dues
These are cash-flow visibility failures — not moral failures.
What Actually Improves Visibility
The fix is not a more complicated spreadsheet. Most Indians already tried that and stopped. The fix is reducing the effort required to see the truth.
- See all channels together — Bank, UPI, cards, EMIs, auto-debits — one timeline beats five apps
- Group by category, not by merchant — Food, rent, EMI, shopping, subscriptions, transfers
- Separate needs, wants and obligations — Rent and EMI are not the same as impulse delivery
- Watch recurring charges weekly — Subscriptions and mandates compound quietly
- Compare this month to last month — Trends matter more than a single bad week
- Decide one adjustment — Visibility without action is just better-informed drift
Inly Perspective: Awareness Before Advice
Most personal-finance content jumps to products: start an SIP, open a demat, buy a term plan, get a better card.
Those can be useful. They are the wrong first step if you cannot answer where last month’s money went.
Inly is built around that first step — turning the financial SMS trail you already receive into a clearer view of spending, EMIs, subscriptions, loans and recurring obligations, so you can ask questions like:
- Where did most of my money go this month?
- How much am I spending on food deliveries versus groceries?
- What are my upcoming EMIs and dues?
- Which subscriptions are still active?
- Has my discretionary spending risen versus last month?
The point is not austerity. The point is intentional spending.
Bharat’s Money Lens. Understand Before You Spend.
Frequently Asked Questions
Quick answers grounded in the same official sources cited above.
Is it true that most Indians don’t budget?
Not exactly. NCFE-FLIS 2019 found that about 74% of respondents said their household had a budget. The bigger gap is operational: people may feel they budget, yet still cannot reconstruct category-level spending across UPI, cards and auto-debits.
What share of Indians are financially literate?
Under the OECD-INFE thresholds used in NCFE-FLIS 2019, 27.18% of respondents met the combined knowledge, behaviour and attitude minima. Later NSFE mid-term evaluation work reports improvements in several demographic groups versus those 2019 baselines, but methodology and sample size differ from the original 75,000-person survey.
Does UPI make people spend more?
National UPI statistics prove extraordinary payment activity — not a causal claim that UPI alone raises every household’s spending. What is clear is that frictionless payments reduce the natural pauses that once made spending memorable.
How much do Indian households consume on average?
HCES 2023–24 (MoSPI) estimates average MPCE at ₹4,122 rural and ₹6,996 urban. Non-food items account for roughly 53% of rural MPCE and 60% of urban MPCE.
Are Indians still saving?
Yes at the macro level. RBI’s Annual Report shows household saving at 21.3% of GNDI in FY 2024–25, with net household financial saving at 7.0% of GNDI. Saving aggregates do not automatically mean individual households have clear visibility into monthly leaks.
What is the simplest first step?
Pick one recent month and rebuild it by category — food, rent/EMI, shopping, subscriptions, transfers, and “don’t know.” The size of the “don’t know” bucket is your visibility gap.
Final Takeaway
India solved a hard problem: making payments work at national scale.
The next hard problem is quieter. It is helping ordinary households see their own money clearly enough to choose — not just react.
UPI volume, card spends, rising non-food consumption and uneven financial literacy are not separate stories. They are one story: money moves fast; understanding moves slowly.
When you know where your money goes, you stop guessing why the month disappeared. You start deciding what the next month should look like.
Understand your money before you spend it.
Download Inly and get a clearer view of your spending, EMIs, subscriptions and financial patterns — in one place.
Inly — Bharat’s Money Lens. Understand Before You Spend.
Sources: NPCI UPI Product Statistics (August 2026); RBI retail payment and credit-card statistics (August 2026 as reported); World Bank Global Findex 2025 (India account ownership and inactivity figures); NCFE-FLIS 2019 / NSFE documentation (27.18% OECD-threshold literacy; household-budget prevalence; urban–rural and gender splits); Mid-Term Evaluation of NSFE 2020–25 (subgroup literacy comparisons vs 2019 baselines; ~10,000-respondent evaluation frame); MoSPI HCES 2023–24 factsheet (MPCE and food/non-food shares); RBI Annual Report 2024–25 (household saving as % of GNDI); RBI Financial Stability Report cycle (household debt-to-GDP and non-housing retail share as cited). Statistics retain their original survey periods and definitions. Household examples are illustrative and do not constitute financial, investment or tax advice.