· 13 min read
Inflation and Household Budgets in India: Why Headline CPI Does Not Tell the Whole Story
Inflation is usually reported as one national number. For households, it is never that simple.
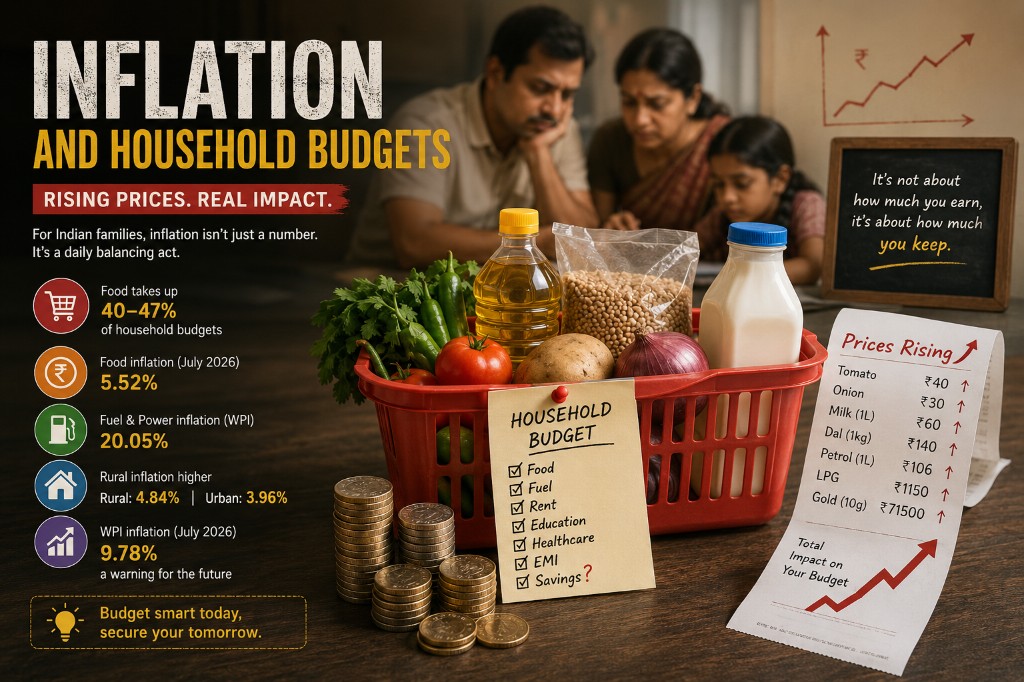
A family that spends nearly half its monthly budget on food feels a vegetable shock far more sharply than a household whose biggest costs are rent, travel and discretionary spending. A 10% rise in onion prices can hurt more than a 30% rise in jewellery prices, even if both feed into the official Consumer Price Index.
That gap between the headline and the kitchen table has become especially important in 2026.
- Headline CPI: CPI — July 2026, YoY
- Rural CPI: Rural — Above the national average
- Urban CPI: Urban — Softer than rural
- Food inflation: Food — The household pressure point
- Wholesale WPI: WPI — Input-cost warning
These figures matter. The more useful question for Indian families is different: how much of their income is actually being eaten by inflation? The answer depends on what they buy, where they live, how much they earn, whether they receive welfare support, and whether wages are rising faster than their personal cost of living.
India's Inflation Story Has Changed Several Times
There has not been one continuous inflation cycle since 2015. Moderate consumer inflation through 2015–19 gave way to food and pandemic distortions, then a global commodity and energy shock in 2021–23, then gradual disinflation, then an unusually calm stretch in parts of 2025. 2026 is a renewed acceleration in food, fuel and selected input costs — not a repeat of the post-2021 explosion in prices across the economy.
- 6.65%: FY23
- 5.36%: FY24
- 4.63%: FY25
- 1.71%: Apr–Dec 25
- 4.45%: Jul 26
The climb back toward 4.5% looks modest next to FY2022-23. It is still economically meaningful after a year when retail inflation averaged only about 1.71% between April and December 2025. Today's pressure remains concentrated in food, fuel and a few categories rather than a broad overheating of every price in the economy.
The Real Question Is Which Inflation
Composition matters more than the average. India's CPI, now rebased to 2024=100 using the newer Household Consumption Expenditure Survey, still gives food the largest weight — but less than the old index. Housing and services have gained importance as incomes rise and households spend relatively less on cereals and more on mobility, healthcare, communication and education.
Averages still mislead. Poorer households remain far more food-dependent than the national basket implies.
- 36.75%: Food & beverages
- 17.67%: Housing, water, electricity, gas & fuels
- 8.80%: Transport
- 6.38%: Clothing & footwear
- 6.10%: Health
- 4.47%: Furnishings & household maintenance
- 3.61%: Information & communication
- 3.35%: Restaurants & accommodation
- 3.33%: Education
Rural and Urban India Do Not Share the Same Bill
HCES 2023-24 puts average monthly per-capita consumption at about ₹4,122 in rural India and ₹6,996 in urban India. Including imputed welfare transfers lifts those figures only slightly, to around ₹4,247 and ₹7,078. The mix of spending is the more important difference.
- Rural: Monthly per-capita spend
- Urban: Monthly per-capita spend
- Rural: Food share of budget
- Urban: Food share of budget
- Rural: Milk
- Urban: Milk
- Rural: Vegetables
- Urban: Vegetables
- Rural: Processed food & refreshments
- Urban: Processed food & refreshments
- Rural: Rent — Often implicit or owned
- Urban: Rent
Food inflation therefore functions almost like a regressive tax. When vegetables, pulses, milk, oil or cereals become expensive, rural and lower-income households lose more purchasing power because those items consume a larger share of income. Urban households are relatively more exposed to rent, transport, fuel, education, restaurants and purchased services. One national CPI print cannot describe the cost-of-living pressure on 1.4 billion people.
July 2026: Where the Inflation Actually Came From
Food and beverages inflation of about 5.24% contributed roughly 1.93 percentage points to the headline — the largest single driver. Personal care and miscellaneous inflation printed at 14.77%, but a large part of that came from precious metals, not everyday toiletries. Silver jewellery inflation was around 109.84%; gold, diamond and platinum jewellery around 32.98%. Ginger was up about 83.62%, onions 22.54% and garlic 35.36%, while potatoes were down around 16.56% and tomatoes around 4.59%.
- 1.93 pp: Food & beverages (5.24%)
- 0.74 pp: Personal care & miscellaneous (14.77%)
- 0.39 pp: Transport (4.43%)
- 0.38 pp: Housing, utilities & fuels (2.16%)
- 0.26 pp: Restaurants & accommodation (7.72%)
- 0.22 pp: Clothing & footwear (3.38%)
- 0.12 pp: Education (3.64%)
- 0.08 pp: Health (1.34%)
A very high inflation rate in a small discretionary category can move the index without wrecking household welfare. Moderate inflation in a large essential category does the opposite. That is the most important principle in reading India's CPI.
₹300 Extra Does Not Mean the Same Thing to Everyone
The bottom 5% of rural India's consumption distribution spends only about ₹1,677 per person per month. The urban bottom 5% spends about ₹2,376. At the other end, the top 5% spends around ₹10,137 in rural India and ₹20,310 in urban India.
Suppose essentials rise by ₹300. For a rural household at the bottom of the distribution, that is nearly 18% of monthly per-capita expenditure. For someone spending ₹10,137, it is less than 3%. The rupee shock is identical. The welfare shock is not. This is why inflation hurts poorer households even when the official CPI rate is the same for everyone.
- Rural bottom 5%: Monthly per-capita spend
- Share of a ₹300 shock: For the rural bottom 5%
- Rural top 5%: Monthly per-capita spend
- Share of the same shock: For higher rural spenders
Household Inflation Is Really About Purchasing Power
Inflation becomes financially damaging when prices outrun household resources. An 8% salary rise against 5% personal inflation still leaves you better off. A 4% rise against 7% essential-cost growth leaves you poorer in real terms even though the payslip is larger. That gap between nominal income and real income is one of the most misunderstood ideas in personal finance.
India currently has stronger official consumption data than income-distribution data. A National Household Income Survey is underway in FY2026-27, so consumption remains the best official proxy for material living standards.
Real purchasing-power growth ≈ income growth − your household inflation
The Recent Good News on Real Consumption
Despite the post-pandemic inflation shocks, HCES shows real consumption improved. At constant 2011-12 prices, rural monthly per-capita expenditure rose from ₹2,008 to ₹2,079 between 2022-23 and 2023-24. Urban expenditure rose from ₹3,510 to ₹3,632. That is roughly 3.5% real growth in both rural and urban India. The rural consumption Gini fell from 0.266 to 0.237; the urban Gini from 0.314 to 0.284.
National averages still hide geography. Rural MPCE grew about 13.8% in Odisha and 13.2% in Telangana, but only around 3.4% in Maharashtra — implying weaker, possibly negative, real rural purchasing power there if national inflation is used as a rough benchmark.
- 13.8%: Odisha
- 13.2%: Telangana
- 11.8%: W. Bengal
- 11.6%: Kerala
- 11.5%: Karnataka
- 3.4%: Maharashtra
State inflation in July 2026 also diverged — Telangana around 6.32%, Andhra Pradesh 5.72%, Tamil Nadu 5.44%, Puducherry 5.41%, Madhya Pradesh 4.91%. Personal inflation is the product of three things at once: where you live, what you consume, and how your income grows.
Why Food Inflation Is India's Household Inflation Problem
Food remains the largest mass-welfare inflation channel. Prices still move with the monsoon, rainfall distribution, yields, heatwaves, storage, transport, farm wages, MSPs, procurement, buffer stocks, import dependence, export curbs and global edible-oil markets. Vegetables are especially volatile because cycles are short and storage is limited. Pulses and oils sit at the intersection of domestic production and world trade.
Diets are also changing. As incomes rise, households shift from cereals toward milk, fruits, vegetables, pulses, proteins, processed food and eating out. Processed food, beverages and refreshments already account for roughly 9.84% of rural expenditure and 11.09% of urban expenditure; milk alone is 8.44% and 7.19%. Demand is diversifying faster than parts of the agricultural supply chain are modernising.
Food Inflation Can Become General Inflation
A tomato shock is not automatically a monetary-policy problem. Repeated food inflation can become one. Restaurants pay more for ingredients. Workers ask for higher wages. Firms protect margins. Households begin to expect higher inflation, and those expectations seep into contracts. Research behind this analysis found substantial historical spillover from food inflation into non-food and aggregate inflation several months after a shock.
That is RBI's dilemma. Higher interest rates cannot grow more onions or build cold storage. The central bank also cannot ignore food inflation if it starts changing economy-wide expectations.
The WPI–CPI Gap Is a Warning, Not a Forecast
July 2026 showed CPI at 4.45% against WPI at 9.78%, with fuel and power wholesale inflation around 20.05%. Wholesale inflation does not automatically become retail inflation. Margins, taxes, inventories, competition and demand all sit in between. Persistent input-cost pressure does raise the odds of pass-through. For household budgets, treat the WPI spike as an early-warning indicator — not a prediction that consumer inflation will hit 10%.
- CPI: What households currently feel at retail
- WPI: What producers are paying for inputs
- Fuel & power WPI: The sharpest wholesale pressure
- Repo rate: Held with a neutral stance, Aug 2026
What Families Cut First When Prices Rise
Inflation rarely shrinks every line of the budget in equal proportion. Adjustment happens in stages. Substitution comes first. Discretionary spending is postponed next. Then quasi-essentials — healthcare visits, education extras, house maintenance, diet quality — start to compress. Savings fall to protect current consumption. Borrowing may follow. Credit cards, personal loans, BNPL or informal loans can bridge a month. They also turn today's price shock into tomorrow's EMI.
- Substitution — Cheaper brands, seasonal vegetables, lower-cost proteins, home cooking and subsidised staples.
- Discretionary cuts — Eating out, recreation, clothing replacement, electronics and durables get postponed.
- Quasi-essentials compressed — Healthcare, educational extras, house maintenance and diet quality start to slip. This is where inflation becomes more damaging.
- Savings reduced — Households protect present consumption by saving less.
- Borrowing rises — Credit smooths the shock — and can transfer the problem into future EMIs.
Who Is Most Exposed
Low-income rural households carry a very high food share and little discretionary room. Casual labour households in rural India spend roughly ₹3,652–₹3,653 per person per month, against around ₹5,005 for regular non-agricultural wage households — and income volatility compounds price inflation. Low-income urban renters and commuters sit in a different basket: rent, transport, fuel and purchased services, with urban CPI assigning roughly 25% to housing, utilities and fuels. Families with significant medical needs are vulnerable even when healthcare inflation looks modest, because those bills are hard to postpone.
Welfare Changes the Inflation You Actually Feel
A household receiving free foodgrain does not face the same cereal inflation as one buying all its wheat and rice in the open market. PDS and PMGKAY matter for that reason. The five-year extension of free foodgrain from January 2024 has an estimated fiscal cost of about ₹11.8 lakh crore, or around ₹2.13 lakh crore a year. That is a powerful hedge against staple cereals.
It is a thinner shield against the rest of the food budget. Free rice and wheat do little when milk, vegetables, pulses, edible oils, eggs, LPG and medicines rise. India's welfare architecture is highly effective against cereal-price poverty, and less complete against broader food-budget inflation.
Why RBI Cannot Solve the Entire Problem
The inflation framework targets CPI around 4%, with a 2–6% tolerance band. In 2022 RBI tightened aggressively to stop persistent inflation spreading. Monetary policy still cannot fix crop failures, cold-storage gaps, agricultural logistics, imported crude shocks or global edible-oil shortages. Interest rates mainly affect borrowing, investment, credit growth, aggregate demand and expectations.
Temporary tomato inflation should not automatically trigger tightening. Persistent food and fuel inflation that begins spreading into wages, services and expectations might. In August 2026, RBI held the repo rate at 5.25% with a neutral stance, waiting for clearer evidence of persistence.
What Households Can Actually Control
Households cannot set national inflation. They can reduce how much of it they absorb unthinkingly. Stop treating headline CPI as a personal number. Track housing, food, transport, utilities, healthcare, education, debt servicing and discretionary spend. If a household spends ₹1 lakh a month — ₹25,000 on housing, ₹20,000 on food, ₹12,000 on transport, ₹10,000 on education, ₹5,000 on healthcare, ₹8,000 on utilities, ₹20,000 discretionary — inflation in those lines matters more than India's published average.
- Income: Grow faster than your personal inflation, not the CPI print — An 8% raise against 6% household-cost growth is closer to a 2% real gain.
- Emergency fund: Recalculate the target in today's rupees — Six months of last year's expenses can quietly become five months after sustained inflation.
- Savings returns: Read fixed deposits after inflation — and tax — A 6.5% deposit against 5% household inflation leaves thin real growth before tax.
- Debt: High-interest credit is inflation on top of inflation — Card APRs of 30–40% turn a price shock into a lasting cash-flow problem.
Budgeting is more useful when it watches inflation-sensitive categories. Knowing groceries moved from ₹15,000 to ₹18,000 is more actionable than knowing headline CPI moved from 4% to 4.5%. That is exactly the kind of visibility Inly is built to provide — so your own inflation rate is not a guess.
The Bigger Economic Lesson
India's long-term inflation challenge is less about interest rates than about supply. Sustainable household inflation control needs agricultural productivity, irrigation, climate-resilient farming, pulses and oilseed capacity, cold chains, storage, logistics, energy security, public transport, urban housing, healthcare and education supply. Monetary policy cannot permanently solve onion shortages, vegetable shocks, expensive crude, housing scarcity or hospital capacity. Those require structural reform.
Final Takeaway
Headline inflation is useful for monetary policy. It is not a perfect measure of household stress. A household spending ₹1,700–₹4,000 per person each month experiences a food and fuel shock very differently from one spending ₹20,000 per person.
India entered the second half of 2026 with a harder mix than late 2025: CPI above 4%, stronger food inflation, rural inflation above urban, and a sharp wholesale input-cost spike. This still does not look like simple economy-wide overheating. Much of the pressure remains in food, fuel and supply-sensitive categories.
For policymakers, supply management, farm productivity, logistics and targeted protection of vulnerable households are as important as the repo rate. For households, the lesson is simpler.
Do not merely track India's inflation rate. Track your inflation rate.
The number that determines your financial progress is the gap between how fast your income grows and how fast your own cost of living grows.