· 15 min read
India's Rising Middle Class: From Aspiration to the New Economic Centre
For decades, India’s economic story was told in two extremes: poverty reduction on one side, a thin rich elite on the other.
That framing is outdated.
A large, restless middle is moving into the centre of India’s economy — buying cars and scooters, booking flights, running SIPs, paying rent and EMIs, scanning UPI QR codes, and quietly reshaping what “normal” household finance looks like.
India’s middle class is no longer a marketing slogan. It is becoming the country’s main economic engine — and its biggest personal-finance challenge.
Who Counts as Middle Class in India?
There is no single official government definition of “middle class.” Different researchers use different income bands. That is why headlines often disagree.
One of the most widely cited Indian frameworks comes from People Research on India’s Consumer Economy (PRICE), based on its ICE 360° household surveys.
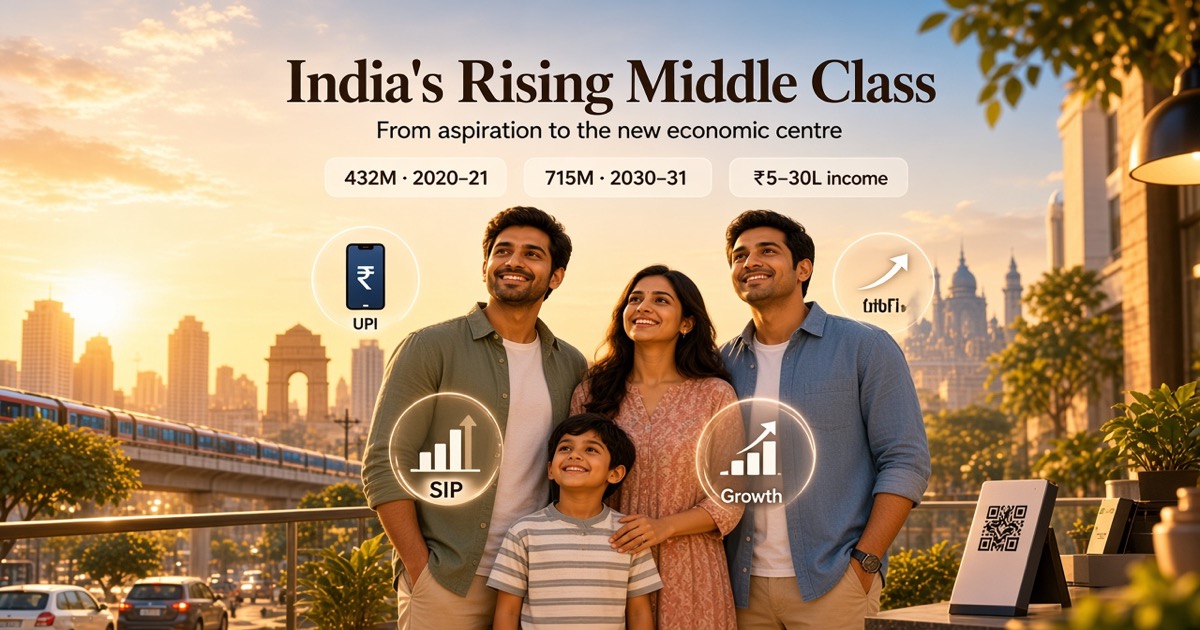
PRICE defines middle-class households as those with annual household income of ₹5 lakh to ₹30 lakh at 2020–21 prices — roughly ₹298 to ₹1,770 per person per day.
Within that band:
• Seekers: roughly ₹5–15 lakh household income • Strivers: roughly ₹15–30 lakh household income
This is an income-based research definition, not an RBI or MoSPI official category. It is useful because it is transparent — and because PRICE publishes both historical estimates and long-range projections under that definition.
- Household / year: Income band — PRICE middle-class definition
- Approx. range: Per person / day — At 2020–21 prices
- Lower middle band: Seekers — Grew ~4.8% a year (2015–21)
- Upper middle band: Strivers — Grew ~6.4% a year (2015–21)
How Large Is India’s Middle Class — and Where Is It Heading?
Under the PRICE definition, India’s middle class was about 432 million people in 2020–21 — roughly 31% of the population, up from about 14% in 2004–05.
PRICE projects:
• 715 million people (about 47% of population) by 2030–31 • Nearly 1.02 billion people (about 61% of population) by 2046–47
In the same framework, the “Destitute” share falls sharply over time, while the “Rich” share expands — transforming India’s income pyramid into something closer to a middle-class bulge.
These are research projections, not destiny. They depend on growth, jobs, inflation, education and policy. But the direction of travel is clear: India is becoming a middle-class economy in absolute numbers.
- ~31% of population: 2020–21 — Survey-based estimate
- ~47% of population: 2030–31 — PRICE projection
- Middle class share: 2004–05 — Historical estimate
- Middle class share: 2020–21 — Survey year
- Projected share: 2030–31 — PRICE projection
- Projected share: 2046–47 — ~1.02 billion people
Why the Middle Class Matters Economically
Size alone is not the full story. In PRICE’s 2020–21 profile, the middle class was already the country’s biggest contributor among consuming classes on three fronts:
- About 50% of household income
- About 48% of household expenditure
- About 52% of household savings
That is why businesses, banks, fintechs and policymakers watch this segment so closely. When the middle class expands, consumption expands — and so do mortgages, vehicle loans, education spending, insurance, mutual funds and digital payments.
- ~50%: Income share — Middle class contribution
- ~48%: Expenditure share — Middle class contribution
- ~52%: Savings share — Middle class contribution
- Engine: Implication — Growth + household risk sit here
What Official Economy Data Shows Alongside This Rise
Middle-class expansion does not happen in a vacuum. Macro and survey data help explain the backdrop.
Growth is still creating room
MoSPI’s Provisional Estimates put real GDP growth at 7.7% in FY 2025–26 (constant prices), after 7.1% in FY 2024–25. Sustained growth does not automatically create a middle class — but without growth, large-scale income mobility is much harder.
Households are spending more — and more on non-food
MoSPI’s Household Consumption Expenditure Survey (HCES) 2023–24 estimates average monthly per capita consumption expenditure (MPCE) at ₹4,122 in rural India and ₹6,996 in urban India.
Non-food spending now dominates:
• Rural: food 47.04%, non-food 52.96% • Urban: food 39.68%, non-food 60.32%
That shift — toward conveyance, durables, communication, education, health and miscellaneous goods — is classic middle-class consumption behaviour. Essentials still matter. Discretionary and semi-discretionary categories are rising.
- 52.96%: Rural non-food — Of rural MPCE
- 60.32%: Urban non-food — Of urban MPCE
- 47.04%: Rural food — Of rural MPCE
- 39.68%: Urban food — Of urban MPCE
Rural–urban gaps are still large — but narrowing in some measures
In HCES 2023–24, urban MPCE is still far above rural MPCE in rupee terms. But the urban–rural gap as a percentage of rural MPCE has compressed versus 2011–12 levels in MoSPI’s published comparisons.
World Bank urbanization data still put India’s urban population share around 37% in 2024 — so a large part of India’s middle-class story will continue to be written outside metros: in towns, peri-urban clusters and better-connected rural districts.
Signals You Can See in Everyday Markets
Income surveys tell one story. Market proxies tell another — often louder.
Digital payments are already middle-class infrastructure
NPCI data show UPI processed 24.51 billion transactions worth ₹29.82 lakh crore in August 2026 alone.
For middle-class households, UPI is no longer a novelty. It is the default settlement layer for groceries, rent top-ups, school fees, fuel, food delivery and small business payments. Frictionless payments raise convenience — and make spending harder to remember.
SIPs show financialisation, not just optimism
AMFI’s August 2026 industry note reported:
• Monthly SIP contributions of ₹32,297 crore (+14.3% year-on-year) • About 10.02 crore contributing SIP accounts • SIP assets of ₹18.62 lakh crore — roughly 21.4% of mutual-fund industry AUM
That is a structural change in how middle-income households try to build wealth. Equity participation is no longer limited to a narrow metro elite.
- Transactions: UPI volume — August 2026
- Monthly: SIP inflows — +14.3% YoY
- Contributing accounts: Active SIPs — August 2026
- ~21.4% of MF AUM: SIP AUM — Retailisation of markets
Mobility and travel remain aspiration markers
Passenger-vehicle wholesale dispatches were estimated around 4.6 lakh units in September 2026, up roughly 21% year-on-year in industry reporting after GST-related demand effects — a reminder that vehicle ownership remains a powerful middle-class milestone, even as affordability and price hikes matter.
Domestic air travel stayed large: Icra-cited figures put FY26 domestic passengers at about 1,677.4 lakh (16.774 crore), up 1.4% year-on-year. Flying is no longer only for the rich; it is increasingly a middle-class occasion purchase.
The Quiet Risk: Rising Income Without Rising Clarity
A larger middle class does not automatically mean healthier household balance sheets.
RBI data show household debt rising to 45.5% of GDP by September 2025, with non-housing retail loans accounting for 58.4% of household borrowings in the related report cycle. Credit cards, personal loans and small-ticket retail credit can fund middle-class lifestyles — or quietly stress them.
At the same time, RBI’s Annual Report shows household-sector saving still substantial: 21.3% of GNDI in FY 2024–25, with net household financial saving at 7.0% of GNDI.
The tension is real:
- More income
- More products
- More EMIs
- More SIPs
- More subscriptions
- Less visibility into the monthly whole
Many middle-class households are simultaneously investing and revolving — building SIPs while carrying high-interest dues. That combination can look like progress in one app and stress in another.
What “Rising Middle Class” Looks Like Inside a Household
Strip away the national charts and the lived pattern is familiar:
- Salary credit feels bigger than five years ago
- Rent or EMI takes a fixed first claim
- UPI makes daily spends painless
- Credit cards convert convenience into next-month obligations
- SIPs create a sense of discipline
- School fees, health, fuel and family support absorb the rest
- Month-end still feels tighter than expected
The middle-class paradox is not that people earn too little to care. It is that they earn enough to access complexity — and complexity without clarity becomes expensive.
Five Personal-Finance Priorities for India’s Middle Class
National growth creates opportunity. Household systems determine outcomes.
- See the full month in one place — Bank + UPI + cards + EMIs + auto-debits — not five half-views
- Protect the floor first — Emergency buffer before aggressive investing
- Separate good debt from lifestyle debt — Home/education vs revolving consumption credit
- Automate investing after cash-flow truth — SIPs work best when they are not funded by card interest
- Track recurring leaks — Subscriptions, convenience fees, unused mandates
- Review once a month — Income up is not the same as surplus up
Inly Perspective: The Middle Class Needs a Money Lens
India’s middle class is growing into more products, more payments and more obligations.
What it needs next is not another slogan about aspiration. It needs visibility.
Inly helps households understand financial activity from the transactional SMS trail they already receive — spending patterns, EMIs, subscriptions, loans and recurring dues — so questions like these become answerable:
- Where did most of this month’s money go?
- How much is locked into EMIs versus discretionary spends?
- Are subscriptions and mandates quietly rising?
- Is my surplus growing with my income?
- What is due in the next 7 days?
A rising middle class that cannot see its own cash flow is growing on uncertain ground.
A rising middle class that understands its money can compound both income and intention.
Bharat’s Money Lens. Understand Before You Spend.
Frequently Asked Questions
Quick answers grounded in the sources cited above.
How big is India’s middle class today?
Under PRICE’s ₹5–30 lakh household-income definition (2020–21 prices), about 432 million people were middle class in 2020–21. Newer official government statistics do not publish a single competing “middle class” headcount under the same band.
Will India’s middle class really reach a billion people?
PRICE projects nearly 1.02 billion middle-class people by 2046–47 under its definition and growth assumptions. That is a research projection, not an official forecast. Outcomes depend on jobs, productivity, inflation and policy.
Is India already a middle-income country?
In World Bank country classifications, India has been in the lower-middle-income group in recent years. That is a national GNI-per-capita label — different from household “middle class” definitions used by PRICE or Pew-style global poverty/income tiers.
Does rising middle class mean everyone is financially secure?
No. Expanding incomes can coexist with thin emergency buffers, high retail debt, and weak spending visibility. Macro prosperity and household resilience are related — not identical.
What should a middle-class household track first?
Monthly cash flow by category, EMI burden as a share of income, revolving credit, and whether investments are funded by true surplus.
Final Takeaway
India’s rising middle class is one of the most important economic stories of this century.
Hundreds of millions of people are moving into income bands that support vehicles, housing aspirations, education spending, market investing and digital consumption. Projections suggest that by the 2040s, middle-class India could be the majority under widely cited research definitions.
But the personal-finance lesson is sharper than the growth headline.
A bigger middle class creates bigger opportunity — and bigger room for silent financial mistakes.
The households that win will not be the ones who merely earn more.
They will be the ones who can answer, every month: where did our money go, and did that match what we said we value?
Understand your money before you spend it.
Download Inly and get a clearer view of your spending, EMIs, subscriptions and financial patterns — in one place.
Inly — Bharat’s Money Lens. Understand Before You Spend.
Sources: People Research on India’s Consumer Economy (PRICE), The Rise of India’s Middle Class / ICE 360° surveys (₹5–30 lakh household-income definition at 2020–21 prices; 432M in 2020–21; projections to 715M by 2030–31 and ~1.02B by 2046–47; income/expenditure/savings contribution shares); MoSPI Provisional Estimates of GDP (real GDP growth 7.7% in FY 2025–26); MoSPI HCES 2023–24 (MPCE and food/non-food shares); NPCI UPI Product Statistics (August 2026); AMFI Monthly Note (August 2026 SIP figures); Icra-cited domestic air passenger traffic for FY26; industry reporting on September 2026 passenger-vehicle dispatches; RBI Annual Report 2024–25 (household saving as % of GNDI); RBI Financial Stability Report cycle (household debt-to-GDP and non-housing retail share); World Bank urbanization / income-classification context as cited. Statistics retain original survey periods and definitions. Household examples are illustrative and do not constitute financial, investment or tax advice.